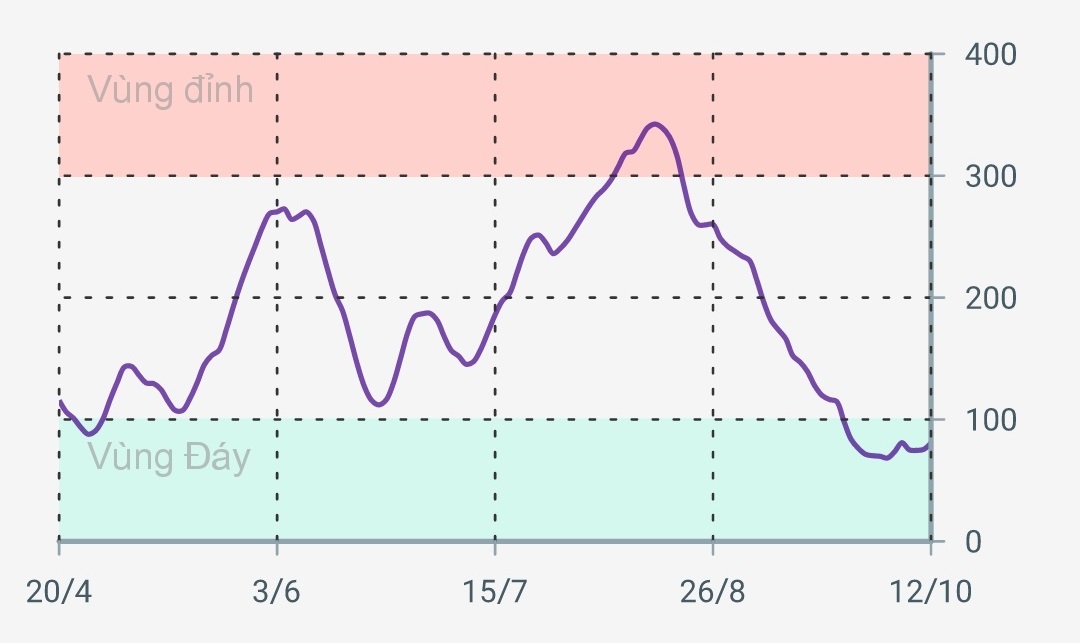
1. Forecasting the top and bottom status of the market
State chart of Vietnam Stock Market (VNINDEX), represented by SIN shape chart with Potential Peaks and Potential Bottoms. You can base on which zone the market is in to consider lowering the stock weight if the market goes to the top, or increase the stock weight when the market goes to the bottom when there is a recommendation. by ICEinvest


2.Forecast of the wave foot state of the market
The market leg chart will help you to grasp when the Market is in a correction phase and shows signs of bottoming and returning to the uptrend. From there, the Wave Foot ICE Robot will recommend you to disburse at the foot of the wave and also the List of the strongest Stocks with the best ability to increase in price at the foot of the wave for you to disburse.
3.Assessment of industry strength
Industry Strength: calculated by Artificial Intelligence (AI) algorithm to calculate the figures and shown in a graph the strength of the 5 strongest industries in the market and which industries are likely to lead the market when The market is in an uptrend. Accordingly, ICEinvest also indicates which line of stocks is the strongest in the market so that you can focus on that industry to increase investment efficiency.


4.Evaluation of stock strength
Stock Strength: Is a ranking of the stock strength of the Stocks with the best strength in the market. Stock strength is calculated by ICEinvest using Artificial Intelligence (AI) algorithms and is a combination of many technical and fundamental analysis indicators of stocks along with cash flow strength.